Pythagorean Expectation Formula
Pythagorean expectation is a formula that estimate how many games a baseball team should have won based on the number of runs they scored and allowed. The term is derived from the formula's resemblance to the Pythagorean theorem.
The basic formula is:

where Win% is the expected winning percentage generated by the formula.
When the Pythagorean expectation formula is applied to basketball the result is similar, except for the exponents:
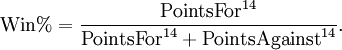
There are orher similar variations for basketball with 16.5 as the exponent instead of 14.
Background Information
- Pythagorean expectation - Wikipedia [View Resources]
- The Pythagorean Expectation [View Resources]
- The Pythagorean Expectation [View Resources]
K-12 Science Fair Projects
- What Makes a Team's Winning Percentage Deviate from the Pythagorean Relationship? [View Resources]
-
What Makes a Team Win More or Fewer than Pythagorean Expectation [View Resources]
Advanced Articles and Studies
- Adjusting football’s Pythagorean Theorem [View Resources]
- Current Major League Baseball Pythagorean expectation [View Resources]
- Derivation of James' Pythagorean Formula (Long) [View Resources]
- Pythagorean Expectation and the Myth of Luck, or How I Learned to Stop Worrying and Accept Northwestern [View Resources]
- Beyond Pythagorean expectation: How run distributions affect win percentage [View Resources]
- The Pythagorean Formula Extended for Soccer [View Resources]
- Future Expectations for Over-Performing Teams [View Resources]
- Confidence Intervals for the Pythagorean Formula in Baseball [View Resources]
Theses and Dissertations
- Regression planes to improve the Pythagorean percentage: A regression model using common baseball statistics to project offensive and defensive efficiency [View Resources]


